Strong May Hiring Shows Labor-Market Resilience U.S. employers added 339,000 jobs in May, and the prior two months’ payrolls were revised up by nearly 100,000—complicating the Fed’s next decision on rates.
U.S. employers added a seasonally adjusted 339,000 jobs in May and the prior two months’ payrolls were revised up by nearly 100,000, the Labor Department said Friday. Workers gained more than 1.5 million jobs in 2023, more evidence of economic vitality, including robust consumer spending and a stabilizing housing market. (…)
The U.S. unemployment rate rose to 3.7% in May, still near historic lows but an uptick from April’s 3.4%, the Labor Department said. Average hourly earnings grew a solid 4.3% in May over the prior year, similar to annual gains in March and April. (…)
The average workweek fell to 34.3 hours, the lowest since April 2020 near the start of the pandemic. As a result of fewer hours worked, average weekly earnings advanced at a slower rate than hourly earnings, and gains have cooled since the start of the year.
The labor-force participation rate, the share of Americans who are working or actively seeking jobs, remained flat in May at 62.6% and below the February 2020 prepandemic level of 63.3%. That partly reflects the aging U.S. population. Among workers age 25 to 54, the participation rate rose to 83.4%, a level last touched in 2007.
May’s job gains were broad-based. (…)
Average hourly earnings rose 0.33% and April was revised to +0.4% from 0.5%. Wages are up 3.8% annualized YtD, down from +4.7% during H2’22. However, wages for production and nonsupervisory workers (80% of the total) rose 0.45% in May up from 0.35% in April and 0.39% in March. They are up 4.6% annualized YtD, down from +5.0% during H2’22.
This payrolls chart illustrates the resilience of labor income growth, +6.2% YoY in May, and the tight fit with total consumer expenditures:

On a MoM basis, aggregate payrolls rose 0.27% in May, right on the average of the previous 3 months. The stacked payrolls contribution chart below shows that wage growth (black) has been steady at +3.7% annualized this year while the sum of jobs and hours worked grew 1.7% a.r.. Excluding the outsize January (warm weather), the labor market and its components have been very steady in the past 12 months.

- Data Boost Likelihood of Short-Lived Pause A continuing strong labor market could lead officials to raise rates higher than anticipated
(…) Friday’s report was the 14th-straight time payroll growth has exceeded Wall Street forecasters’ estimates. Given that streak, “it is hard not to conclude that the labor market just has more momentum than standard models suggest,” said Krishna Guha, vice chairman of Evercore ISI, in a report Friday.
But the contradictory data from the two Labor Department surveys, which can occur at times when economic growth is slowing, “offers a rationale for skipping June with a default to hike again in July unless the data shows more signs of cooling by then,” he said.
The establishment survey has been pretty steady in the past year, unlike the household survey. Household employment declined 310k in May which caused the unemployment rate to spike to 3.7%.

The household series has been unusually erratic post-pandemic suggesting that relying on the unemployment rate to assess the labor market could be dangerous. In fact, the BLS tells us that when adjusted to the payroll definition, household employment was actually up 394,000 in May. It seems better to fade May’s rise in the unemployment rate.

In May, the number of unincorporated self-employed Americans fell by 369,000, dragging the household survey down. There are now 8.73 million Americans who are self-employed without owning their own company. That’s down from a peak of 9.51 million in August 2021, and it’s even lower than the 8.89 million registered in January 2020, before the pandemic hit. (Axios)
Data: FRED; Chart: Axios Visuals
Some of the fall in May in this volatile series might be attributable to the Hollywood writers’ strike, notes The American Prospect’s David Dayen.

Looking at labor supply, the participation rate of Americans aged 25-54 is now exceeding its pre-pandemic level (by 0.5%). But all other age groups remain well below, particularly those aged 55+ who are 5% below and still declining:

Actual employment levels for all age groups are above pre-covid levels except the 55+ group whose employment remains 1.7% below and declining.

This seems to reflect another “unexpected” (overlooked) effect of rising interest rates. Personal interest income jumped $160B (+9.5%) since the Fed started to hike, benefitting savers, largely retired/retiring people who had endured a decade of Fed financial repression.

Another example of why the normal monetary policy playbook is not effective.
- The Fed wants to curb demand with higher interest rates which normally primarily hit housing and vehicle demand and hurt construction and manufacturing employment. Combined employment in these swing sectors remains 2.5% above its pre-pandemic level and is up 3.5% since the Fed first hike and has yet to show any weakness. Why? Multi-family construction, government infrastructure spending, reshoring, and worker shortages.
- The 70 million baby boomers (21% of the total population) have a net worth of $73.1 trillion (52% of the total), up $43T (145%) since 2009 thanks to the explosion in house prices (+102%) and equity values (+275%) as the Fed kept interest rates lower for longer post the GFC. Per Ed Yardeni: “During April, consumers had record or near-record amounts of proprietor’s income ($1.9 trillion), interest income ($1.8 trillion), dividend income ($1.7 trillion), and rental income ($0.9 trillion).” The pandemic and financial repressions are over and boomers are spending, much of it on services like travel, eating out, and health care. Higher rates are actually boosting such spending.
- Total household debt servicing was 9.7% of disposable income in Q4’22, unchanged from the end of 2019 and down from 12.4% on average before the last 3 recessions (ex-covid).
- Significantly, mortgage debt and HELOCs account for 72.6% of consumer debt in the U.S. We can easily assume that most of it is 30-year mortgages at fixed interest rates much lower than today’s. Mortgage debt servicing is now 4% of disposable income.
- Even the so-called “goods recession” did not dent “goods employment”, still up 450k (+2.5%) since 2019.

-
Meanwhile, the much larger services sector has seen its number of employees swell by 3.3M (+2.5%). During the first 5 months of 2023, services jobs have been rising by 295K per month on average, twice the pace between 2017 and 2019.
-
The reality is that the goods sector, now less than 14% of all employment, is not responding much to tighter monetary policies, even less so when consumers are still flush with helicopter money. Demand for services is much less impacted by rising interest rates, even less so when baby boomers spend their wealth accumulated during years of extremely loose monetary policies and now boosted by rising interest rates which also contributes to reduced labor supply. Not only are Fed policies not effective, they are in many ways counter productive.
-
It’s true that monetary policy works with lags, but one has to admit that even after a 500bps jump in 15 months, higher interest rates have yet to show any visible effect on employment, consumption and even core inflation, all well above pre-covid levels and all still in uptrends:

In all, the tight monetary policy is actually having little, if any, impact on consumer demand, employment and inflation. The conventional monetary policy playbook is not doing its normal job in the current unusual environment following the monetary and fiscal experiments after the GFC.
What could “save” a pausing Fed and produce the desired immaculate disinflation?
- Excess savings are gradually being exhausted. Goldman Sachs estimates a Q4’23 end.
- Federal student loans will need to be serviced again by the fall, after a 42-month pause. That will impact 34 million borrowers who have saved about $15,000 each over that period. But was it actually saved…or spent?
- Commodity prices, including energy prices, could keep declining, particularly if China underperforms.
- Corporations could stop hoarding labor if overall demand drops and/or profit margins decline.
In truth, nobody really understands this rather unusual economy. But what if the Fed keeps lifting rates?
- Larry Summers: “We’ve still got a tight, hot labor market. If they don’t raise rates in June, I think they have to be open to the possibility that they may have to raise rates by 50 basis points in July if the economy continues to stay way hot and if inflation figures are robust”.
- KKR sees “six percent short rates as the ‘red line’ where Fed policy dramatically retards growth and capital formation required to sustain positive, forward momentum.”
What would 6% rates do to a market widely expecting rate cuts this year?
Last week, Steve Blumenthal alerted subscribers to his Trade Signals of “A Rare –4 Zweig Bond Model Reading”
It’s not often that the Zweig Bond Model reaches a –4 Sell Signal reading. The last time it registered a –4 reading was in 2007. Prior to that was in 1989. And of course, there was the inflation era in the 1970s early 1980s.
Ned Davis Research calculates that when the Zweig Bond Model is on Sell, bonds provide negative returns in nominal terms vs +9.8%/annum when on Buy.
All four of Blumenthal’s fixed income indicators are currently giving sell signals.
Vehicles Sales at 15.05 million SAAR in May; Up 19.6% YoY
The BEA estimates sales of 15.05 million SAAR in May 2023 (Seasonally Adjusted Annual Rate), down 6.5% from the April sales rate, and up 19.6% from May 2022.

We are still 2M short vs pre-covid trends. Hence:

Saudi Arabia Cuts Oil Output After OPEC Members Clash Over Quotas Riyadh and some other producers also extend earlier voluntary curbs
Saudi Arabia said Sunday it would cut 1 million barrels of oil a day as part of a deal between OPEC and its allies after one of the most contentious production meetings in recent years amid concerns over slowing global energy demand.
Saudi Arabia said the output cut was for July and on top of previously announced curbs, which would be extended until the end of 2024. The United Arab Emirates and some other large producers also extended their previously announced cuts.
The Saudi announcement came soon after the Organization of the Petroleum Exporting Countries and its Russia-led allies said the group had agreed to stick to current production targets until the end of the year. Each member of the cartel, called OPEC+, is allotted a production quota, but sometimes members don’t hit that level. (…)
OPEC+ announced adjustments to collective targets that would reduce the cartel’s overall production ceiling by almost 1.4 million barrels a day next year. Russia, along with three African countries—Nigeria, Angola and Congo—will bear the brunt of those cuts while the U.A.E. received a bigger allocation, for which it has lobbied hard for years. (…)
The decision to keep the additional 1-million-barrel cut in July open for extensions is “likely put in place to discourage future short positioning,” it said. (…)
Saudi officials and other people familiar with Saudi oil policy say Riyadh is under pressure to maintain higher oil prices, with its budget requiring an estimated $81 a barrel to break even. In recent months, Saudi economic advisers have privately warned senior policy makers that the kingdom needs elevated oil prices for the next five years to keep spending billions of dollars on ambitious projects that have so far attracted meager investment from abroad.
- According to Airportia data, air traffic remains strong, still up more than 200% YoY. (@C_Barraud)

US hotel developers run out of cash as construction lending dries up
Tighter lending standards from regional banks are making it harder for U.S. hotel developers to secure funding, slowing construction of new hotels at a time Americans’ appetite for travel is ripe.
Hotel developers, private equity firms, and general contractors told Reuters the financial stress on regional banks — the largest lenders to hotels and other commercial real estate markets — has forced developers to postpone projects or find other creative ways to raise capital. (…)
Following the collapse of Silicon Valley Bank in March, California developer Shopoff Realty Investments paused construction of Dream Las Vegas, a 21-story hotel and casino resort, and said the firm was trying to secure more financing.
Since March, 59 of the 98 total U.S. hotel projects that broke ground or were in the pre-construction phase this year have been paused, according to previously unreported data shared with Reuters by Build Central Inc., a subscription-based research and analytics firm used by some large hotel brands to gauge market opportunities by location.
“The regional banks that used to be active for us 9 to 12 months ago are not showing up to finance hotels for us today,” said MCR Hotels Chief Investment Officer Joseph Delli Santi, the third-largest U.S. owner-operator of hotel brands including Hilton.
Over the past year, access to loans and higher construction costs have delayed projects across Florida, Texas, and California, said James Hansen, executive vice president of business development of hotel developer and operator Hotel Equities, adding that the regional bank upheaval had extended wait times for construction loan approvals.
Chief executives of major hotel companies, Hilton Worldwide Holdings Inc (H.N) and Marriott International (MAR.O), have also alluded to the issue – warning of a reduction in hotel developments as credit becomes more expensive and less available, in their latest earnings calls. (…)
As lending criteria grew more stringent, smaller hoteliers without existing lending relationships began to hit roadblocks, said Andy Ingraham, a hotel developer and president of the National Association of Black Hotel Owners, Operators, and Developers.
Ingraham said he and other members are struggling to get financing for various projects.
In some cases, private equity firms have stepped in to fill in funding gaps for construction loans, but at steeper costs, said Evens Charles, chief executive of Frontier Development and Hospitality Group, a Washington D.C. developer whose portfolio includes 10 hotels.
“I’m hearing 9-10% (interest rates) and it’s coming from a 4% environment two-and-a-half years ago,” he said. (…)
Banks started to reduce their hotel loan portfolios in the first quarter of 2023, an analysis by S&P Global Market Intelligence found. Based on available data from regulatory filings, the study showed 14 of 24 banks that held more than $125 million in outstanding hotel and motel loans reported quarter-over-quarter decreases. (…)
Elevated interest rates and inflated raw material costs due to supply chain backlogs were already hurting hotel developers even before the regional banking crisis, said Mitchell Hochberg, president of Lightstone Group, a New York-based private real estate investor and developer with a $3 billion portfolio of hotel properties.
The firm is putting the brakes on new projects.
“It’s getting harder to pencil in a good hotel deal,” he said. “A lot of developers would prefer to sit on the sidelines until rates come down rather than be burdened with the excess costs.”
The latest Fed data through May 29 show loans and leases are still growing, even more so at smaller banks:

EARNINGS WATCH
We got 9 new pre-announcements last week, 2 positive an 5 negative. Compared with after Q1, half as many companies guide negatively so far.

Q2 EPS are now seen down 5.4%, worse than the -3.9% expected on April 1.

Trailing EPS are now $220.02. Full year 2023: $220.89. Forward 12m: $225.50.

TECHNICALS WATCH
- The 13-34w EMA trend:

- The 200d m.a. has flattened:

- Extended:

- The equal-weight S&P 500 200dma is turning down:

- Bad breadth:

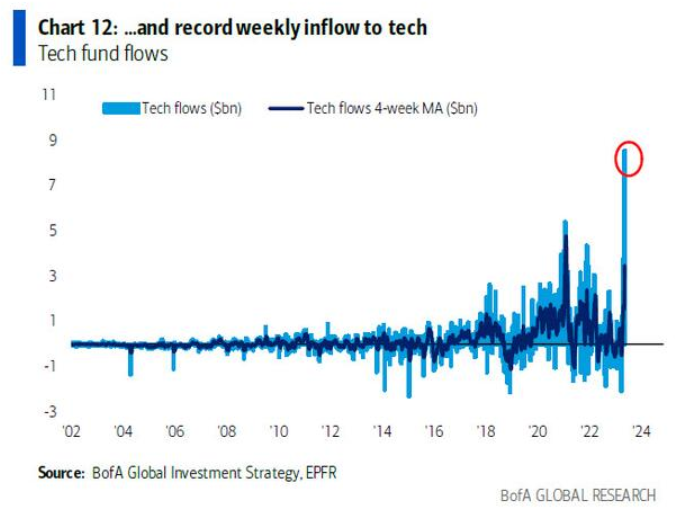
- We just saw the largest weekly inflow to tech ever (@Mayhem4Markets)
- Speculative fervor is coming back as well. In a note to clients at the end of last week, Deutsche Bank pointed out that the volume of call-option buying in tech and Mega Cap Growth is nearing its highest levels of the pandemic era. (Joe Weisenthal)

-
Americans feel good…about themselves…

Data: Federal Reserve “Survey of Household Economics and Decisionmaking.” Chart: Axios Visuals
Big Banks Could Face 20% Boost to Capital Requirements Those relying on fees might need bigger buffers to absorb losses under planned rules.
U.S. regulators are preparing to force large banks to shore up their financial footing, moves they say will help boost the resilience of the system after a spate of midsize bank failures this year.
The changes, which regulators are on track to propose as early as this month, could raise overall capital requirements by roughly 20% at larger banks on average, people familiar with the plans said. The precise amount will depend on a firm’s business activities, with the biggest increases expected to be reserved for U.S. megabanks with big trading businesses.
Banks that are heavily dependent on fee income—such as that from investment banking or wealth management—could also face large capital increases. Capital is the buffer banks are required to hold to absorb potential losses.
The plan to ratchet up capital is expected to be the first of several steps to beef up rules for Wall Street, a shift from the lighter regulatory approach taken during the Trump administration. (…)
Institutions with at least $100 billion in assets might have to comply, effectively lowering an existing $250 billion threshold for which regulators have reserved their toughest rules. (…)
The new framework was completed in 2017, but efforts to implement it in the U.S. were delayed by the pandemic. The Fed is playing a leading role in crafting the measure, along with the Federal Deposit Insurance Corp. and the Office of the Comptroller of the Currency.
All three agencies are expected to seek comment on the proposed capital rules. They would have to vote again to complete the changes, likely implementing them over the coming years.
They are also expected to propose ending a regulatory reprieve that had allowed some midsize banks to effectively mask losses on securities they hold, a contributing factor in the collapse of SVB. Supporters of the change say it would have forced SVB to address the issue earlier as interest rates began rising and the value of its holdings declined.