The enemy of knowledge is not ignorance, it’s the illusion of knowledge (Stephen Hawking)

It ain’t what you don’t know that gets you into trouble. It’s what you know for sure that just ain’t so (Mark Twain)

Invest with smart knowledge and objective odds

YOUR DAILY EDGE: 8 October 2024

New feature: EDGE AND ODDS’ DaiLY CHAT.

Most days, I will provide a link to an AI generated chat on the day’s post courtesy of Google’s NotebookLM. Not totally satisfying but worth offering to readers on the go. No support charts however and some AI generated conclusions not really mine….

And there is much more on the blog itself.

And if you sense hallucinations, editorializing and patronizing, I will totally fault AI Winking smile.

October 7, 2024

October 8, 2024

FED WATCH

Top Fed official says US economy ‘well positioned’ for soft landing New York Federal Reserve president John Williams signals support for quarter-point interest rate cuts

The Fed’s #2 said yesterday as the FT reports:

  • “The current stance of monetary policy is really well positioned to both hopefully keep maintaining the strength that we have in the economy and the labour market, but also continuing to see that inflation comes back to 2 per cent,”
  • “I don’t want to see the economy weaken. I want to maintain the strength that we see in the economy and in the labour market.”
  • If inflation fell even faster than expected, that “would call for policy to normalise a little bit more quickly”. Conversely, if inflation stalled, “that would call for interest rates to come down more slowly”.

Former Bank of Canada Official Sees Jumbo Rate Cut in October ‘I would really bet on 50 basis points,’ Paul Beaudry says

There are “good reasons” to move interest rates “back to as close to neutral as quickly as possible,” former Deputy Governor Paul Beaudry said, including boosting household and business optimism.

Now that policymakers are more sure that wage growth, expectations and corporate pricing are going in the right direction, Beaudry sees borrowing costs moving lower faster as the bank eyes a sustainable return to 2% inflation. (…)

At 4.25%, the benchmark rate continues to weigh on growth. The central bank says the neutral rate — a theoretical level of interest rates that neither restricts nor stimulates the economy — is 2.75%. While Beaudry admits there’s uncertainty about the precise level, he reiterated that its clear borrowing costs should fall “pretty quickly and get there.” (…)

HOUSING NORMALIZING?

CalculatedRisk charts single-family active inventory, up 36.7% YoY. It’s still down 23.1% vs 2019 but the red line is not showing its normal seasonality so far and housing inventory might get close to 2019 levels in coming months if the trend continues.

Redfin reports:

Pending U.S. home sales were flat from a year earlier during the four weeks ending September 29, marking the first time since January pending sales didn’t decline. It’s worth noting that we’re comparing to a period last year when sales slumped as mortgage rates surged into the mid-7% range. 

Pending sales increased year over year in 27 of the 50 most populous U.S. metros, the most since January. (Sales are still posting big declines in Florida, where homebuyers have backed away due largely to climate disasters and rising insurance and HOA costs. Pending sales fell 18% year over year in West Palm Beach, more than anywhere else in the country, followed by 16% drops in Fort Lauderdale and Miami.)

Redfin’s Homebuyer Demand Index–a measure of tours and other buying services from Redfin agents–is up 9% month over month to its highest level since April. Homebuyers locked in more than twice as many mortgages than they did a month earlier on September 30, according to Optimal Blue data, and mortgage-purchase applications are up 10% month over month.

The average 30-year mortgage rate dropped to 6.08% last week, its lowest level in two years, pushing the typical homebuyer’s mortgage payment down to $2,529, near its lowest level since January. That’s a 5.9% decline, the biggest year-over-year drop since May 2020.

A normalization of the housing market would mean the economy would start to benefit from one of its missing elements. Would that be positive?

Certainly for construction workers.

But wait, construction employment is 9% above its pre-pandemic level while total housing starts are down. Imagine if single-family housing demand recovers.

image

BTW: Construction Trades Most Reliant on Immigrant Workers

Immigrants make one in four construction workers. The share is significantly higher (31%) among construction tradesmen. In some states, reliance on foreign-born labor is particularly evident, with immigrants comprising 40% of the construction workforce in California and Texas. In Florida, 38% of the construction labor force is foreign-born. In New York and New Jersey, 37% of construction industry workers come from abroad.

Supported by a substantial increase in immigration to the United States since 2022, labor shortages in construction have eased but remain elevated.

The concentration of immigrants is particularly high in construction trades essential for home building, such as plasterers and stucco masons (64%), drywall/ceiling tile installers (52%), painters (48%), roofers (47%), carpet/floor/tile installers (46%). The two most prevalent construction occupations, laborers and carpenters, account for over a quarter of the construction labor force. A third of all carpenters and 41% of construction laborers are of foreign-born origin

In the latest February 2024 HMI Survey, 65% of builders reported some or serious shortage of workers performing finished carpentry. Looking at other tradesmen directly employed by builders, the shortages of bricklayers and masons are similarly acute, despite a high presence of immigrant workers in these trades.

Labor shortages are also high among electricians, plumbers and HVAC technicians, with over half of surveyed builders reporting shortages of these craftsmen. In contrast, these trades demand longer formal training, often require professional licenses and attract fewer immigrants.

US Consumer Borrowing Growth Slows on Drop in Revolving Credit Credit card balances fell in August by the most since 2021

Total credit outstanding rose $8.9 billion after a revised $26.6 billion July increase that was the largest since October 2022, according to Federal Reserve data released Monday.

Revolving debt outstanding, which includes credit cards, decreased nearly $1.4 billion. Non-revolving credit, such as loans for vehicle purchases and school tuition, increased $10.3 billion.

The decline in revolving debt outstanding suggests consumers are focused on reducing credit-card balances that are carrying much higher interest rates than they were years ago. (…)

image

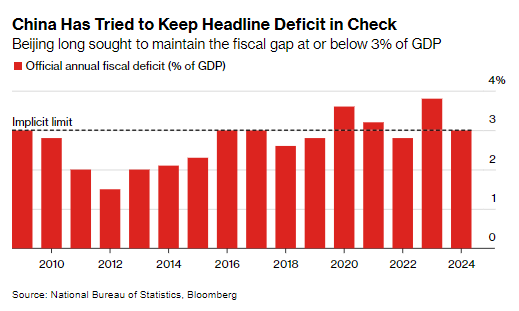
China Vows to Hit Economic Goals, Stops Short of Large Stimulus  Top planning agency wants to speed up investment in key areas

China said it’s confident in reaching its economic targets this year and promised to further support growth, although it held back in unleashing more major stimulus in a disappointment to investors looking for more fuel for a world-beating stock rally.

Officials in the National Development and Reform Commission, the country’s economic planning agency, said Tuesday they would speed up spending while largely reiterating plans to boost investment and increase direct support for low-income groups and new graduates. They added that China would continue to issue ultra-long sovereign bonds next year to support major projects and bring forward a 100 billion yuan ($14 billion) investment in key strategic areas originally budgeted for 2025 to this year. (…)

“Nothing much is new compared to the previous announcements, and the latest commitment to fiscal stimulus looks weaker than market expectations,” said Gary Ng, senior economist at Natixis SA. “The front-loading of fiscal spending will only help stabilize growth and will not be enough to engineer a sharper rebound.” (…)

Authorities will introduce “as soon as possible” specific measures to expand the areas allowed to receive funding support from the sales of special local government bonds, NDRC’s Zheng said. Some economists have called on policymakers to permit the bond funds to be used to finance local governments’ purchases of unsold homes from developers to reverse a deepening housing slump.

The agency will also urge local officials to issue the remainder of this year’s new special bonds — worth about 290 billion yuan — by the end of this month, Liu Sushe, a vice chairman of the NDRC, said at the same briefing. In 2023, China ordered provinces to use up the year’s special local bond quota before adding 1 trillion yuan of sovereign bonds in late October to stimulate the economy.

The NDRC said certain sectors, like basic public services in cities and inter-city transportation networks, will receive more funding support from government bonds. (…)

Image

China’s expansion is set to drop to 4.3% next year from an estimated 4.8% in 2024, the lender said in its semi-annual economic outlook report. As a result, growth in East Asia and the Pacific — which includes countries like Indonesia, Australia and Korea — will slow to 4.4% in 2025 from about 4.8% this year. (…)

The World Bank’s growth projection for China this year is in line with estimates in a Bloomberg survey, but its 2025 forecast is slightly lower than the median of 4.5%. (…)

While US-China trade tensions have created opportunities for countries like Vietnam to play a role in linking major trading partners, “new evidence suggests that economies may be increasingly limited to playing a ‘one-way connector’ role as new, more stringent rules-of-origin on imports and export restrictions are imposed,” the World Bank said. (…)

NATE SILVER ON THE ELECTIONS

Meanwhile, the polling has also been rudderless — and there hasn’t been much of it lately. Following her debate with Trump, Harris expanded her national lead from roughly 2 points to 3 points, and it’s remained there pretty much ever since. That extra point is useful on the margin since it might be just enough to help Harris overcome the Electoral College bias — but the race remains a toss-up for all intents and

image

YOUR DAILY EDGE: 7 October 2024: No Landing?

New feature: EDGE AND ODDS’ DaiLY CHAT.

Most days, I will provide a link to an AI generated chat on the day’s post courtesy of Google’s NotebookLM. Not totally satisfying but worth offering to readers on the go. No support charts however and some AI generated conclusions not really mine….

And there is much more on the blog itself.

And if you sense hallucinations, I will totally fault AI Winking smile.

October 4, 2024

October 7, 2024

September Employment: Some Sizzle in a Cooling Trend

Nonfarm payroll growth in September blew past expectations, expanding by 254K compared to a consensus forecast of 150K. Perhaps even more encouragingly, job growth in August and July was revised higher, reversing a string of reports when the revisions to job growth in prior months were negative.

Coming into today, the three-month moving average on monthly nonfarm payroll growth was 116K. Today’s print, when paired with the upward revisions, pushes the three-month moving average up to a much more robust 186K.

The sectors that have led the charge on employment growth in recent months once again posted strong gains. Leisure & hospitality (+78K), healthcare (+45K), government (+31K) and social assistance (+27K) accounted for 71% of the job growth in September despite only accounting for roughly 40% of total employment.

Overall hiring was more widespread in September, with the diffusion index of industries adding jobs rising to 57.6. However, the amount of jobs added by various other industries was still somewhat underwhelming. For example, professional & business services were up by 17K, finance up 5K and information up 4K. Manufacturers continued to shed jobs last month (-7K), while hiring at temporary staffing agencies fell for the 28th time in 30 months.

The household survey offered a further hint of the jobs market stabilizing in September. The unemployment rate edged down to 4.1%, its second consecutive monthly drop. Although still up from 3.7% at the start of the year, the jobless rate has been in the 4.1%-4.3% range since June in a sign that the negative effects associated with job loss (e.g., weaker income, spending) are not building on themselves and that employers are still able to absorb entrants to the labor force.

To that end, September’s dip in the unemployment rate was driven by a sizable increase in the household measure of employment (+430K) and decline in unemployed workers (-281K). The labor force participation rate remained unchanged at 62.7% (…).

Average hourly earnings rose more than expected, posting an increase of 0.4%. After an upward revision to August, average hourly earnings are up 4.0% over the past year. Although still noticeably above the pace that prevailed over the past cycle, we do not see the firming in September as a risk to derailing the current downward trend in inflation.

The underlying trend in the labor market still seems to be toward gradual cooling, and a pickup in productivity growth further tempers the inflationary pressures emanating from the labor market. The Fed will be looking more closely at its preferred gauge of compensation pressures, the Employment Cost Index, which is due on October 31.

The September jobs report offers an encouraging sign that labor market conditions are stabilizing, but we are not quite ready to declare victory over the shaky labor market data that pushed the FOMC to cut the fed funds rate by 50 bps two weeks ago.

Demand for new workers has turned to merely lukewarm, as indicated by the downward trend in job openings, contractionary PMI employment readings, drop in small business hiring plans and faltering consumer perceptions of job availability. Fortunately, layoffs remain low, but an upturn could lead to a further downshift in net payroll growth with firms reluctant to take on new workers.

For now, the gradual, rather than sudden, cooling in the jobs market appears supportive of the FOMC easing by 25 bps instead of a second-straight 50 bps rate cut at its next meeting on November 7. However, prior to the Committee’s next gathering, there will be one more employment report released on November 1, in addition to a key read on labor costs (the Q3 Employment Cost Index on Oct. 31) and another month’s worth of inflation data  that could alter our expectations for the FOMC’s next move.

There are more important details to the employment story:

  • The trailing 3-month job gain is 186k vs the 6-month average of 167k and the 12-month average of 203k. The average monthly gain was 167k in 2019 and 190k each in 2018 and 2017. My black arrow shows a clearly slowing trend. My dashed arrow suggests a possible reacceleration since last April.
Monthly change in non-farm payrolls (000s)

image

Source: Macrobond, ING

  • Since these numbers will be revised three more times, one would be justified to think the reality is much more modest growth. But the last 2 months were actually revised up, after 5 consecutive markdowns!
  • Private employment has clearly slowed in Q3 but not as much as public employment. The diminishing fiscal impulse is now showing in the jobs numbers.

image

  • That said, September private payrolls gains (+223k) followed 3 months of very weak growth (June – August averaged +103k). Was the aberration those unusually weak 3 months or September? Strong corporate profits support continued private jobs growth.

image

  • The drop in the average workweek to 34.2 matches the lowest other than well into a recession, mostly due to service-providers. But both series being at normal times absolute lows, the optimist would say we’ve seen the lows.

image

  • Indeed, “the seasonally adjusted S&P Global US Services PMI Business Activity Index posted 55.2 in September, signaling a marked monthly increase in service sector output at the end of the third quarter, and one that was among the strongest in the past two-and-a-half years. New order growth was recorded for the fifth month running, with the latest solid expansion only slightly softer than the 14-month high seen in August.” Private services employment rose 202k in September after +109k in August and +78 in July. Private service-providing jobs account for 72% of all jobs in the USA.
  • The unemployment rate actually declined to 4.05%. What’s the Sahm rule saying now? The Sahm Rule holds that a slowdown will result if the unemployment rate rises by 0.5 percentage points above its low for the previous 12 months. The big August selloff was driven in part by the triggering of the Sahm Rule. Two months later, we’re back to the 0.5% threshold; it’s still not at all clear that the economy is tipping into recession.” (John Authers)
  • WARN data point to declining unemployment claims:

image

  • Average hourly earnings rose 0.37% MoM after +0.46% in August (revised up) and +0.23% in July. On a quarterly basis, +1.0% QoQ in Q3 after +0.83% in Q2 and +1.06% in Q1. That’s a stable +4.0% YoY. Pre-Covid: +3.2%. The composition adjusted Atlanta Fed’s Wage Growth Tracker is still clocking at +4.6%.
  • The participation rate at 62.7% was unchanged for the 3rd straight month after having risen from 62.5% in December 2023. The labor supply is not rising anymore.

Goldman Sachs now estimates the underlying pace of job growth now stands at 196k after adjusting for the undercounting of immigration in the official statistics and a small overstatement from the birth-death model. That compares with +167k on average in 2019 and 190k in 2018.

  • Ed Yardeni Sees Fed Pausing Rate Cuts for 2024 After Jobs Report Market veteran says September’s rate move was ‘not necessary’
  • ING thinks that “the Fed should be hiking rates with these sorts of figures, not cutting rates.” Recall that Fed officials told us they were committed to keeping the unemployment rate from rising. It fell to 4.05% in September from 4.3% in July. Goldman Sachs reckons that “the earlier increase was largely caused by the temporary challenge of absorbing a surge in immigrant labor supply, which is now slowing.”

This ING chart made the rounds last week but people only looked at the right side of the chart, oblivious to the cycles in the middle when the series decoupled:

Unemployment rate vs Conference Board measure of jobs plentiful less jobs hard to get

Source: Macrobond, ING

Source: Macrobond, ING

The reality is that the sharp deceleration in the labor market in 2023 and H1’24 has stabilized since June. Most economists were surprised by the uptick in the July JOLTS data but the more current Indeed Job Postings show that labor demand has steadied 12% above pre-pandemic levels through the end of September.

image

Also steady is the growth in aggregate weekly payrolls (employment x hours x wages), still above 5% YoY. suggesting similar growth in consumer spending amid slowing inflation now close to 2%.

image

The consumer is in great shape entering the final and most important stretch of the year. Strong holiday sales would clear any excess inventories that may still exist, setting the stage for better manufacturing demand. Manufacturing jobs declined 44k since June (-11k/month) while service-providing jobs rose 626k (+156k/month).

EARNINGS WATCH

Early reporters from LSEG IBES:

21 companies in the S&P 500 Index have reported earnings for Q3 2024. Of these companies, 76.2% reported earnings above analyst expectations and 23.8% reported earnings below analyst expectations. In a typical quarter (since 1994), 67% of companies beat estimates and 20% miss estimates. Over the past four quarters, 79% of companies beat the estimates and 16% missed estimates.

In aggregate, companies are reporting earnings that are 3.5% above estimates, which compares to a long-term (since 1994) average surprise factor of 4.2% and the average surprise factor over the prior four quarters of 6.5%.

Of these companies, 71.4% reported revenue above analyst expectations and 28.6% reported revenue below analyst expectations. In a typical quarter (since 2002), 62% of companies beat estimates and 38% miss estimates. Over the past four quarters, 62% of companies beat the estimates and 39% missed estimates.

In aggregate, companies are reporting revenues that are 0.1% above estimates, which compares to a long-term (since 2002) average surprise factor of 1.3% and the average surprise factor over the prior four quarters of 1.1%. The estimated earnings growth rate for the S&P 500 for 24Q3 is 5.0%. If the energy sector is excluded, the growth rate improves to 7.1%.

The estimated revenue growth rate for the S&P 500 for 24Q3 is 4.0%. If the energy sector is excluded, the growth rate improves to 4.8%.

The estimated earnings growth rate for the S&P 500 for 24Q4 is 12.5%. If the energy sector is excluded, the growth rate improves to 14.8%.

Surprised smile Note that the actual Q3 earnings growth for these 21 companies is +23.8% on revenues up 2.7%! Twelve of the 21 are consumer centric, 5 tech.

Only 3 sectors are expected to report above average earnings growth in Q3 but there is a meaningful broadening starting in Q4.

image

Trailing EPS are now $234.91. Full year 2024e: $241.28. Forward 12m: $266.66e. Full year 2025e: $276.45 (Goldman Sachs is at $268).

image

Goldman Sachs’ “equal-weight S&P 500 P/E” model (real yields, the distance of forward inflation from 2%, the tightness of the labor market, demographics, and the change in EPS growth) suggests the equal-weight S&P 500 should trade at 15x, below the current level of 17x.

Our aggregate vs. equal-weight P/E model is a function of the difference in consensus long-term EPS growth and return on equity between the aggregate index and the median stock, as well as CEO confidence. This model suggests the premium should equal 45%, above the current level of 25%. Taken together, the current aggregate P/E of 22x is in line with “fair value.

image

The Rule of 20 P/E, which says fair P/E is 20 minus inflation (16.8, the current equal-weight P/E) is at 27.7.

image

Nothing is really cheap but:

  • no recession in sight
  • rising profits
  • stable/declining inflation

Goldman says the current period resembles the 1998 cycle of positive economic growth and a Fed cutting rates. “In that episode, the P/E overshot our modeled fair value by 40%.” At 27.7, the R20 P/E is 38.5% above fair value.

In April 1999, the R20 P/E was 32.0, 60% above fair value. It took 4 years, a recession and a 32% decline in the Rule of 20 Fair Value (yellow line above) before the market retreated to the “20” fair P/E.

FYI via Callum Thomas:

  • October Surprise? Seasonality is generally bad during October in election years. We are heading into the peak period of uncertainty, and no doubt many twists and turns into the final stretch of the election campaign (not to mention the various macro/geopolitical risks lurking in the background).

Source:  @callieabost

Corporate Insiders Are Sitting Out the 2024 Stock-Market Rally Warren Buffett, Jamie Dimon and Jeff Bezos are among the business leaders exhibiting caution

(…) Of all U.S. companies with a transaction by an officer or director in July, only 15.7% reported net buying of company shares, according to InsiderSentiment.com. That was the lowest level in the past 10 years. The figure ticked up to 25.7% in August before falling to 21.9% in September, well below the 10-year average of 26.3%. (…)

image

This year, the largest insider trades have been sales by leaders of big tech companies.

Bezos, the founder and executive chair of Amazon, has sold stock valued at about $10.3 billion, while Michael Dell, chairman and chief executive officer of Dell Technologies, has sold $5.6 billion, and Zuckerberg, chairman and CEO of Meta, has sold $2.1 billion, according to Washington Service data. Shares of all three companies are up by double-digit percentages this year.

Palantir Technologies Chairman Peter Thiel and Nvidia CEO Jensen Huang are also among the top sellers. Both stocks have more than doubled in 2024. (…)

A review of insider purchases, leaving aside sales, also appears to show little enthusiasm lately. Officers and directors of U.S. companies bought $2.3 billion of their companies’ stock this year through September, the lowest amount over such a period since 2014, according to data from the Washington Service. Last year, they bought $3 billion in the first nine months.

image
  • The INK Insider Sentiment Indicator:

As we head into October, the INK US Indicator remains frozen around 30% at which point there are only three stocks with key insider buying for every 10 with key selling over the past 60 days. Insiders continue to signal that stocks are overvalued in relation to the risks. On the positive side, the fact that the indicator has not dropped further in reaction to recent broad market gains suggests there remains a significant number of stocks in the market that continue to offer potential opportunity.

image
  • Gurufocus’ longer term chart shows that insiders are better buyers than sellers:

image

VALUE INVESTORS?

Fifty-two years of experience and still amazed by financial creativity. Ben Graham and Cohen & Zinbarg taught me how to look for value. Net cash, net working capital, book value, particularly tangible book value. Pretty simple.

What did they know? We’re lucky to have Bloomberg in our time, aren’t we?

In this week’s Drill Down on Bloomberg Television’s ETF IQ, Andrea Eisfeldt of the Anderson School of Management at UCLA stopped by to talk about the Simplify NEXT Intangible Value Index ETF (NXTV). Intangible assets, as Eric Balchunas described, are all the things you can’t measure on a balance sheet — brand names, ideas, patents, goodwill… you get the idea.

NXTV is a value-oriented tilt on that idea, and as such, is light on tech stocks but heavy on telecom. As Eisfeldt said: “Those companies that are intangible-heavy, they have a lot of knowledge-capital, brand-capital, organization-capital, data-, people-, customer-capital, they can be value companies.”

We can now invest in unmeasurable “value”!

Well, professor Eisfeld says she actually can measure intangibles, looking for specific items in P&Ls and balance sheets such as expenses for “R&D, advertising, marketing, team-work building exercises, compensation for top employees, etc.” or assessing the value of “patents, data, code, trade secrets, customer capital, trademarks, logos, social media accounts, corporate identity, best practices, corporate culture, etc.”.

I have analyzed thousands of companies in my life and I do not recall having seen most of these items in financial statements, let alone the “etc.”.

But even if one can track and actually measure these items, how do we measure their efficacy, which is what we should ultimately be aiming at?

The NXTV ETF is sponsored by a company named Simplify. Here’s a hint for them: return on capital.

That might simplify the investment exercise and, perhaps, help them reduce the number of stocks in their Intangible Value ETF from its current 186 names.

Two of those 186 names (average weight 0.5%) each carry a 4.9% weight in the fund. AT&T and Verizon achieved ROC of 5.1% and 6.8% respectively during the 12 months ended last June. Their only value for investors might be in their dividend yield, 5.1% and 6.1% respectively.

But even their dividends may not prove tangible for long: T’s payout ratio is 64% while VZ’s is 99%.