Goldman Sees Risk of 10% Drop in Euro If Trump Wins US Election Bank keeps $1.10 year-end forecast, sees parity as possibility
Goldman Sachs Group Inc. said the euro could drop as much as 10% versus the dollar if Donald Trump and the Republicans win next month’s US elections and enact high global tariffs and generous domestic tax cuts.
The bank already believes that an outperforming US economy and relatively high rates will keep the dollar strong, and it sees a risk that strength in the greenback could last even longer than its forecasts if next month’s vote results in “much higher” tariffs. It also said the yuan could fall 12% under that scenario.
Investors have been ploughing into the dollar ahead of the presidential vote on Nov. 5, emboldened by solid US earnings and growing speculation that the Federal Reserve will be less aggressive in cutting interest rates. While Goldman’s base case is still for the euro and the yuan to rebound from current levels by the end of the year, it says a slump in both currencies can’t be ruled out depending on the outcome of the vote. (…)
While the race remains close, strategists see a Trump victory and Republican sweep of Congress adding to its rally, as Trump has threatened to slap tariffs on China, Mexico and other countries, which would likely crank up inflation and keep US rates high. (…)
Cahill said that the euro could depreciate “closer to 10%” if Washington slaps 20% tariffs on China and 10% levies on other countries. That scenario would push the euro down below parity to around 0.97, a level last seen in late 2022. But for now, Goldman is sticking with its forecast for the euro to end the year at $1.10, and rise to $1.15 in 12 months’ time.
Various tariffs on Chinese products could send the yuan to 7.4 per dollar, its weakest according to data compiled by Bloomberg going back to 2010. An analysis of the former president’s trade policy between 2018 and 2019 shows the Chinese currency depreciated 0.7% versus the dollar for each $10 billion in implied tariff revenue, the bank said.
In a scenario under which Trump imposes 60% blanket tariffs on Chinese imports, the yuan could drop to 8 per dollar, he added. (…)
U.S. Economy Again Leads the World, IMF Says International Monetary Fund upgrades U.S. growth outlook as strong investment boosts productivity
(…) In what has become something of a trend, the IMF upgraded the outlook for both U.S. and global growth, though more for the former.
The IMF projects U.S. gross domestic product to expand 2.5% in the fourth quarter from a year earlier—half a percentage point higher than a July forecast, which itself was an upgrade from a January estimate. U.S. output rose 3.2% in 2023.
That would be the fastest among the Group of Seven major advanced economies.
Global output is now projected to grow 3.3% this year, a smidgen above the prior estimate. Focusing just on wealthy nations, the U.S. is increasingly ahead. Advanced economies as a whole are expected to expand 1.9% this year after growing 1.7% last year.
For 2025, the IMF projects the U.S. to grow 1.9%, versus 1.7% for all advanced economies and 3.1% for the global economy.
China, the world’s second-largest economy, is expected to post 4.5% growth this year—a slight downgrade from a prior estimate—and 4.7% in 2025, after expanding 5.4% last year. The euro area’s economy is expected to grow 1.2% this year and 1.3% next year, after expanding 0.2% last year.
The IMF attributed the latest boost in the U.S. outlook to higher nonresidential investment and stronger consumer spending, which is being supported by rising real, or inflation-adjusted, wages. Real wages tend to rise when productivity grows, because companies that become more efficient can pay their workers more.
Investor money has flooded the U.S. in recent years, while big legislative packages funded green energy and infrastructure. Meanwhile, abundant domestic supplies largely insulated U.S. companies from energy shortages and price shocks.
Economists say that has all led to a surge in investment in the U.S., which boosts productivity—or output per hour worked. Productivity is the main ingredient for higher long-term growth and living standards. (…)
According to the IMF, U.S. gross fixed capital formation—a broad measure of investment—will rise 4.5% this year from 2023, more than triple the rate for all advanced economies. From 2016-2025, the IMF estimates U.S. investment will have grown an average 3.3% a year, versus 2.3% for all advanced economies.
By comparison, investment spending is projected to fall 2.7% this year in Germany, previously the juggernaut of Europe, after falling 1.2% last year.
This is a big shift. In the prior decade, from 2006-2015, U.S. investment spending grew an average 1.2% a year, roughly in line with the advanced-economy average. (…)
The abundance of energy supplies helped to keep a lid on prices in the U.S. after Russia’s invasion of Ukraine, while other countries, particularly those in Europe that relied heavily on Russia, have been hit hard by high energy prices. European Union companies are still paying two to three times more for electricity than U.S. firms, and four to five times more for natural gas, according to a September report from the European Commission. (…)
The IMF said in a September blog post that productivity gains by big U.S. companies are a primary reason why the U.S. and Europe have diverged in recent years. (…)

Lost Decade Ahead For Stocks With Only 3% Annual Returns? (Ed Yardeni)
We’ve been asked to comment on yesterday’s grim forecast by economists at Goldman Sachs that the S&P 500 will produce annualized returns of only 3% (before accounting for inflation) over the next 10 years. They reckon that the range of possible outcomes includes -1% at the low end and +7% nominal returns at the high end.
In our opinion, even Goldman’s optimistic scenario might not be optimistic enough. That’s because we believe that the US economy is in a “Roaring 2020s” productivity growth boom with real GDP currently rising 3.0% y/y and inflation moderating to 2.0%. If the productivity growth boom continues through the end of the decade and into the 2030s, as we expect, the S&P 500’s average annual return should at least match the 6%-7% achieved since the early 1990s. It should be more like 11% including reinvested dividends.
It’s hard to imagine that the total return of the S&P 500 would be only 3% in the future given the returns just from the compounding of reinvested dividends.
Let’s dig into some of the points made by Goldman:
(1) Earnings growth. S&P 500 earnings per share has grown roughly 6.5% per year for nearly a century. Assuming 6% growth over the coming decade (and removing dividends from the equation), valuations would need to be cut in half to produce just 3% annual returns.
(2) Valuation. Much of Goldman’s analysis is a story of high valuations. Conventional wisdom holds that higher starting valuations lead to lower future returns. With the Buffett Ratio (i.e., forward P/S) at a record high 2.9, and the S&P 500 forward P/E elevated at 22.0 times, we agree that valuations are stretched by historical standards.
(3) Profit margin. The forward P/E is relatively low compared to the forward P/S because the S&P 500 forward profit margin has been rising into record high territory and should continue to do so in our Roaring 2020s scenario.
(4) Inflation hedge. Goldman’s forecast does not consider that stocks are historically the best inflation hedge, as companies have embedded pricing power. Meanwhile, bonds suffer as interest rates rise to combat higher inflation.
(5) Market concentration. One of the biggest “worries” in Goldman’s analysis is that the market is highly concentrated. But while the Information Technology and Communication Services sectors are now about 40% of the overall S&P 500, around the same as the peak of the dotcom bubble, these are much more fundamentally sound companies.
These two sectors account for more than a third of the S&P 500’s forward earnings today versus less than a quarter in 2000. We also believe that all companies can be thought of as technology companies. Technology isn’t just a sector in the stock market, but an increasingly important source of higher productivity growth, lower unit labor costs inflation, and higher profit margins for all companies.
(6) Bottom line. In our view, a looming lost decade for US stocks is unlikely if earnings and dividends continue to grow at solid paces boosted by higher profit margins thanks to better technology-led productivity growth. The Roaring 2020s might lead to the Roaring 2030s.


(…) The problem is that the latest issue of The Economist has a front cover story titled, “THE ENVY OF THE WORLD: America’s economy is bigger and better than ever.” The editors could have also titled the story, “US Hard Landing Forecast: Rest In Peace.” Front cover stories like this one have often been contrary indicators.
In 2016, Gregory Marks and Brent Donnelly, analysts at Citibank, looked at every cover story from The Economist going back to 1998, selecting those stories that covered “an emotional or hyperbolic portrayal of an asset class or market-related theme.” They selected 44 cover stories that had either an optimistic or a pessimistic point. They found that impactful covers with a strong visual bias proved after one year to be contrarian 68% of the time. That’s high enough to suggest that market watchers should keep the front-cover curse on their radar.
So be bullish, but stay alert. We will continue to help you do so.
Missing: Business Weeks’s front page.
The insider indicator
(…) While business leaders were busy last week offering reassuring earnings guidance, underneath the rosy outlook was a different trend: They were selling stock.
A gauge of insider sentiment, one that tallies the number of sellers versus buyers, is poised to hit the highest monthly reading in more than three years, data compiled by the Washington Service show.
The figures chime with various high-profile sales that have made headlines recently, including Warren Buffett’s unloading of Apple and Bank of America stock, and retreats by Nvidia insiders, including CEO Jensen Huang.
Granted, some of the exits no doubt have nothing to do with the business outlook, driven instead by the need for cash to buy a house or pay for kids’ tuition. And the stock rally has been mostly invulnerable for months amid Federal Reserve interest rate cuts and generally good tidings on the economy and earnings.
Still, the last time the insider indicator shot up, in July, it was a precursor to market pain, with the S&P 500 subsequently falling 8%.
With equities up nine of the last 10 weeks and benchmarks flirting with valuations rarely seen since the dot-com era, bulls may want to consider whether the people in charge know something they don’t.

The INK U.S. Sentiment Indicator represents companies with buy only transactions divided by companies with sell only transactions:
There is little change in overall US insider sentiment as we head into Q3 earnings season and the November 5th elections. There remain roughly four stocks with key insider selling for every one stock with key insider buying over the past 60 days. That depressed level signals broad market overvaluation, but absolute dollar amounts of insider selling remain within normal ranges.
As such, we would characterize the insider behaviour as cautious, seeking only to purchase stock in the open market when distinct opportunities arise.

Insider sales can be tricky. Better to concentrate on buys:
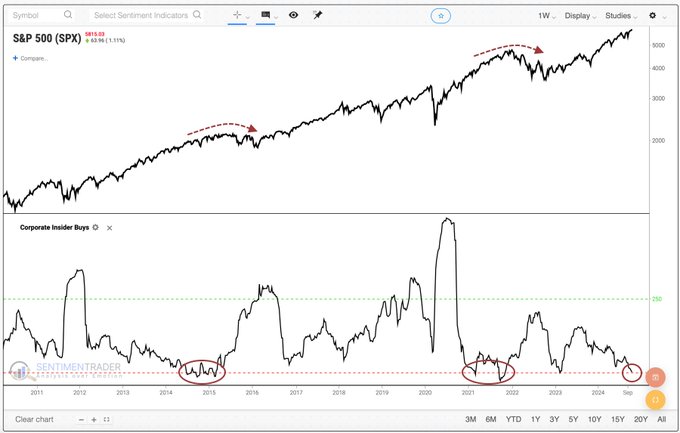
According to SentimenTrader’s Jason Goepfert, the number of insiders buying shares in their companies has recently fallen to levels last seen in September 2021. While insider buying isn’t an exact science, it has in the past been a reliable guide as to whether stocks are looking cheap or expensive.
Corporate executives among S&P 500 firms have some of the least open market purchases in 13 years.