U.S. Flash PMI: Robust upturn in private sector activity amid quicker manufacturing output expansion
U.S. private sector companies reported a further substantial expansion in business activity during July. That said, the rate of growth eased for the second month running to the softest since March, as firms continued to report widespread capacity constraints.
Adjusted for seasonal factors, the IHS Markit Flash U.S. Composite PMI Output Index posted 59.7 in July, down from 63.7 in June. The rate of output growth was the slowest for four months, but robust nonetheless and among the fastest recorded over the survey’s 14-year history.
Manufacturers registered a slight acceleration in the pace of expansion in production, but service providers recorded a further loss of growth momentum amid labour shortages.
Private sector firms continued to signal a substantial increase in new business in July. Although service sector companies registered the softest expansion in new orders for five months, manufacturers noted a quicker upturn. Meanwhile, foreign client demand grew at a solid pace, with exports of goods and services rising at a similar strong clip to that seen in June, albeit down from the survey high recorded in May.
At the same time, cost burdens rose robustly once again in July. With the exception of record rates of input price inflation seen in May and June, the pace of increase was the sharpest since comparable data for goods and services were available in October 2009. Alongside reports of higher raw material and transportation prices, firms also noted greater wage bills as staff were enticed with higher pay in an effort to reduce backlogs of work.
As a result, the rate of selling price inflation for goods and services remained historically steep in July, as firms sought to pass on higher costs to clients. The pace of increase was the third-sharpest on record.
Amid a further strong rise in backlogs of work, companies registered another round of job creation in July. That said, labour shortages in the service sector weighed on total employment growth, which eased to a four-month low.
Finally, the degree of business confidence slipped to a seven-month low. Although still upbeat, firms stated that optimism was dampened by heightened labour and material shortages, rising inflationary pressures and concerns over the pandemic.
The seasonally adjusted IHS Markit Flash U.S. Services PMI™ Business Activity Index registered 59.8 in July, down from 64.6 in June. This indicated that the rate of expansion slowed once again from May’s record high, but remained substantial overall. Where a loss of growth momentum was noted, firms linked this to labour shortages and difficulties acquiring stock.
Contributing to the softer expansion of business activity was a slower upturn in new business across the service sector in July. The pace of growth was the least marked for five months, as some firms noted customer hesitancy amid significant hikes in selling prices. Similarly, the rate of increase in new export orders eased.
Service providers indicated a robust uptick in cost burdens during July, amid hikes in supplier prices and a greater need to hire additional workers. At the same time, the pace of charge inflation remained substantial as firms sought to pass on higher costs to clients.
Although firms recorded a solid increase in employment, the level of outstanding business rose further in July as service providers struggled to keep up with incoming new business. Amid labour shortages and pressure on capacity, firms noted the lowest degree of optimism since February.
July data signalled a fresh series record improvement in operating conditions, as highlighted by the IHS Markit Flash U.S. Manufacturing Purchasing Managers’ Index™ (PMI™) posting 63.1 in July, up from 62.1 in June.
Supporting overall growth was a quicker rise in new orders across the manufacturing sector, as new and existing customers ramped up their spending. Firms also saw a stronger uptick in foreign client demand. In turn, the pace of output expansion accelerated to one of the fastest in seven years. Production rose at a slightly quicker pace despite further reports of material shortages.
In fact, the rate of backlog accumulation quickened to the second-fastest on record (since May 2007), despite the pace of job creation accelerating to the sharpest for three months.
Meanwhile, lead times lengthened markedly and to the second-greatest extent on record. Supply chain disruption was reflected once again in efforts to increase purchasing activity and build safety stocks.
Stronger demand for inputs globally and a scarcity of materials led to the fastest rise in cost burdens on record. Subsequently, the rate of charge inflation accelerated to a fresh series high.

Chris Williamson, Chief Business Economist at IHS Markit:
(…) we’re now seeing nicely-balanced strong growth across both manufacturing and services. While the second quarter may therefore represent a peaking in the pace of economic growth according to the PMI, the third quarter is still looking encouragingly strong.
(…) we’re already seeing signs of inflationary pressures peaking, with both input cost and selling price gauges falling for a second month in July, albeit remaining elevated.
Inflationary pressures and supply constraints – both in terms of labour and materials shortages – nevertheless remain major sources of uncertainty among businesses, as does the delta variant, all of which has pushed business optimism about the year ahead to the lowest seen so far this year. The concern is this drop in confidence could feed through to reduced spending, investment and hiring, adding to the possibility that growth could slow further in coming months.
And now this from Sales Managers
- Sales Growth Index at 29 month high.
- Market Growth Index at 26 month high.
- Staffing Index at 32 month high.
- Business Confidence at 19 month high.
- Profit Index at 31 month high.
- Overall Sales managers Index at 26 month high.
Views on price inflation differ , with considerable opinion believing the current rapid rise of prices most likely to subside shortly as post pandemic product shortages return to more normal levels. Others fear inflation is building up too rapidly to vanish quickly.
The booming U.S. economy is not lost on the non-partisan Congressional Budget Office which just published its latest budget and economic projections. From John Authers:
According to the latest forecast from the Congressional Budget Office, the output gap (the distance between the economy’s actual and potential production) will be eliminated by the end of this year. This chart is from Jitesh Kumar of Societe Generale SA:
Actually, the CBO sees the output gap closing in Q3’21, quickly rising to 1.4% in Q4 on its way to a 2.5% fifty-year record in Q3’23. This significant revision should be at the heart of the next FOMC meeting although noflationists will also note that the CBO nonetheless remains in their transitory camp.
In its February 2021 projections, the CBO did not expect the output gap to close before the end of 2024 but core inflation (CPI) was seen averaging 2.1% in 2022 and 2.3% in 2023. Now, core CPI is seen up 2.5% in 2021 and strangely rise at the same rate through 2028. No transition, one way or the other!
As a reminder, a positive output gap occurs when actual output exceeds potential output, which means the economy is fully employed and overutilizing its resources.
Starting this very quarter, the U.S. economy is fully utilized per the CBO but both monetary and fiscal policies remain set on truly expansionary modes through 2023. This is true for most world economies as austerity is now a banned word.
I am not an economist but I can observe that, historically, when the output gap became positive, hourly compensation tended to accelerate commensurately with the size of the gap. The absence of any meaningful inflation/labor costs pressures in the last 40 years synchs with a generally negative output gap during most of that period.

Up to the late 2000s, labor supply from the 15-64 age cohort was plentiful. It then dwindled and turned negative in 2019. Fortunately, aging baby boomers refused to retire and grew their presence in the labor pool from 20% in 2010 to 25% in 2019.

There are now signs suggesting that this particular pool of labor may not recover to its pre-pandemic level, some 1.2 million boomers having seemingly retired thanks to their exploding investment and housing wealth.

Which brings us to the crucial discussion about inflation which, so far, has been focused on goods inflation, particularly on the recent scarcity-driven inflation, giving comfort to the transitory thesis. But, even after their recent jump, used cars are only 4.0% of core CPI (15% of core goods) and we all know such price spikes are always transitory.
However, few people note how tame core services inflation has been thus far in the recovery, slowing down overall inflation. Services prices are up only 3.5% since February 2020 and only 3.2% YoY in June while total CPI rose 5.3% YoY.

But services prices are stealthily accelerating as the economy reopens and service providers recoup their rising costs amid strong demand finally reaching them.
Services inflation is up 5.6% annualized in the last 4 months. The services sector is 67% of U.S. GDP and 62% of total CPI while core services are 74% of core CPI. Labor costs account for the largest share of service providers’ costs and are thus tightly correlated with services inflation. Trends in compensation feed almost directly into CPI-Services. And wage increases are rarely transitory.

Official stats have yet to reveal any significant wage pressures in services industries. But Markit’s May’s U.S. Services PMI included the first mentions of “greater wage bills” and “challenges enticing workers back to employment”. Friday’s June flash PMI (above) notes “significant hikes” in services selling prices, confirming the numerous anecdotes to that effect in recent weeks.
- Whirlpool Considering More Price Increases if Inflation Exceeds Forecasts The appliance maker in the spring started raising prices by 5% to 12% to offset higher raw material prices
(…) Whirlpool expects $1 billion in additional raw material costs this year. At the moment, the price increases made earlier this year “will cover us, (…). Whirlpool is experiencing supply constraints for crucial components, such as microchips and plastics, which will extend into next year, Mr. Peters said, adding the company has adjusted production schedules in response. (…) [Mr. Peters] doesn’t expect higher sale prices to dent demand for its products (…).
- Harley-Davidson Inc (HOG.N) said last week it would impose an average pricing surcharge of 2% from July 1 on select models sold in the United States to mitigate the cost pressure, which shaved off 5 percentage points from its profit in the latest quarter. Yet the motorcycle maker expects earnings to suffer in the second half of the year. (Reuters)
- [Calder Brothers] is now waiting for a 10% price increase to come into effect in the fall to provide some financial leeway to hand out pay raises of 2% to 4%. In the interim, it has bumped up its contribution to its retirement plan for employees. (Reuters)
A Key Gauge of Future Inflation Is Easing Inflation expectations, an important signal of future inflation, have begun to ease in the past month, a development that should reassure the Federal Reserve in its prediction that the recent inflation surge will prove largely temporary.
(…) Expectations are tracked through a range of surveys and market-based measures, and most are telling the same story. After rising sharply from October through May, they have now begun to ease.
The median expectation of inflation during the next year for consumers surveyed by the University of Michigan shot to 4.8% this month, the highest since August 2008. However, consumers’ one-year expectations are strongly influenced by today’s inflation rate, now a 13-year high of 5.4%. A more-reassuring message comes from their expectations for five to 10 years from now: That came in at 2.9% in early July, down slightly from 3% in May and close to the average of 2.8% in surveys from 2000 to 2019.
Bond investors also don’t seem to be betting on a sustained jump in inflation, based on the “break-even inflation rate”—the difference between the yield on regular Treasury bonds and on inflation-indexed bonds. The break-even rate over the next five years has dropped 0.19 percentage point since mid-May; the rate over the following five years has dropped 0.21 point. (…)
Business inflation expectations have declined, too, since May, as tracked by the Federal Reserve Bank of Atlanta’s monthly survey of around 300 businesses in six states. Companies expected 2.8% inflation a year from now in early July, on average, down from 3% in June, though up from the average of 1.9% from 2012 to 2019. The survey measures businesses’ expectations of their own costs, which may not translate to selling prices. (…)
The Fed’s staff has compiled a “Common Inflation Expectations” index from 21 measures of inflation expectations, including short- and long-term indexes from consumers, markets, businesses and professional forecasters. That index in the second quarter was at levels that prevailed in 2014, a time when inflation was modest, the Fed indicated in minutes of its June meeting. (…)
I don’t know how and where the Fed’s staff compiles its “Common Inflation Expectations” but here’s Edge and Odds’ staff’s compilation of uncommon inflation expectations:

(Bloomberg)
From Markit’s PMI surveys:
- In the June surveys: “[Manufacturing] Input costs rose at the fastest pace since data collection for the series began in May 2007, as greater global demand for inputs put pressure on material shortages. Manufacturers were able to partially pass on higher costs to clients, however, as the rate of charge inflation matched May’s historic peak. Firms overwhelmingly linked the uptick in selling prices to greater cost burdens. Service providers registered the second steepest rise in input costs on record in June. Although the rate of input price inflation eased from May’s recent high, firms continued to highlight rising supplier, fuel and wage costs.
Service sector firms were able to partially pass on higher cost burdens to clients, however, as output charges increased at the second-steepest rate on record, albeit with the rate of inflation cooling from May’s peak. - In the July flash report: “Stronger demand for [manufacturing] inputs globally and a scarcity of materials led to the fastest rise in cost burdens on record. Subsequently, the rate of charge inflation accelerated to a fresh series high. Service providers indicated a robust uptick in cost burdens during July, amid hikes in supplier prices and a greater need to hire additional workers. At the same time, the pace of charge inflation remained substantial as firms sought to pass on higher costs to clients.
The NFIB’s small business survey for June found the share of owners raising average selling prices rose seven points to 47%, the highest reading since January 1981.
") Source: Macrobond, ING
Source: Macrobond, ING
Lastly, today:
U.S. Labor Shortages, Price Pressures to Continue, Survey Shows
At least that’s according to a survey of [93] business economists out Monday, in which only 6% of respondents expect U.S. labor shortages to abate by the end of 2021. Nearly a third of panelists said they didn’t know, indicating elevated uncertainty. (…)
Nearly four in 10 panelists said their firms are experiencing a worker shortage, noting challenges ranging from not enough applicants to plenty of applicants but not enough matches. As a result, more than half of the respondents expect wage costs to increase over the next three months.
Half of the panelists also expect materials costs to rise over the next three months. In many cases, consumers will feel the direct impact of those increases. Forty-three percent said they expect their firms to raise prices in the next three months.
BTW, it’s not limited to the USA:
“It is a workers’ market right now and, as a result, we are also beginning to see employers respond to what workers want; wage increases in places, more flexibility, skills development, and a clear commitment to ESG, especially clarity around an organization’s social and climate impact… Our most recent talent shortage survey of 42,000 employers in 43 countries found that 69% of employers globally, a 15-year high, are reporting difficulties hiring skilled workers across many industries…” – ManpowerGroup (MAN) CEO Jonas Prising (via The Transcript)
")
Fed now facing twin inflation, growth risks as virus jumps and supply chains falter
(…) But since the Fed met just six weeks ago, what had seemed a blue-sky setting for that debate has become clouded by a quadrupling of daily infections led by the more-contagious Delta variant to levels approaching those seen in last summer’s virus surge. (…) So far, the risks to growth remain just that: Data on air travel and restaurant visits show consumers are still in recovery mode, not hunkering down. (…)
Developments since the last meeting “strengthened the case against pulling back on accommodation prematurely,” given the new uncertainty about the recovery and despite higher-than- expected June inflation, Goldman Sachs economist David Mericle wrote. (…)
A collision of events, including floods in Germany and China, are again clogging the flow of parts and materials around the world, prolonging the supply bottlenecks that Fed officials and the White House have counted on getting resolved to help ease price pressures. (…)
“Supply-side issues are clearly not going anywhere,” Citi economists wrote on Friday. “Costs from inputs and supplier wait times are likely to continue appearing in consumer inflation for months to come.” (…)
From a relatively straight-forward and even somewhat old-fashioned dilemma in June – was inflation too high or not? – the Fed now “has risks in two directions,” said former Fed monetary policy director and Yale School of Management professor William English, with the likelihood of more embedded inflation now running alongside risks to growth and the waning of federal fiscal support.
“Things could play out in a way they didn’t expect,” English said.
Covid or rather Delta is back in the limelight as cases surge in e.g., UK and Spain, but the most interesting thing is now to follow the hospitalization data and not the case data, as it seems as if widespread vaccinations among risk groups have decoupled the relationship between cases and hospitalizations. It may be early days still, but the authors of this piece are tempted to claim that the Covid crisis is already over in countries with a decently efficient vaccination program.
The link between cases and hospitalizations, as we knew it from 2020, seems to be broken as the vaccine effectively shields against severe illness. To take an example from a country with an efficient vaccination program. Denmark has had between 0 and 1 daily fatal Covid cases since the late spring. That is around 0.33% of total daily fatalities in Denmark. It seems almost hysterical to keep focusing on lockdowns, border restrictions and the like when there is clearly no health crisis related to Covid-19 any longer from a pure data perspective. The jury is still out, but we find increasingly compelling evidence that the crisis is essentially over (in the West). Let’s move on. (…)
In countries, with a weak or no vaccination program, Delta is likely to become a pain with Australia and Asian countries as clear examples. (…)
BTW, Dr. Fauci says that “in the United States, 99.5% of the deaths from COVID-19 are among unvaccinated people. That is a statistic that just speaks for itself”. Axios reports that “there have been 9000 Covid-19 deaths in Texas since February. All but 43 were not vaccinated.”
ECB Looks to Keep Rates Low for Longer European Central Bank says it won’t increase its key interest rate until inflation moves much closer to 2% target
(…) At a news conference Thursday, ECB President Christine Lagarde said the pandemic continued to cast a shadow over Europe’s economic recovery, even if strong growth is expected over the coming months. “The Delta variant of the coronavirus could dampen this recovery in services, especially in tourism and hospitality,” she said. (…)
The central bank said in a statement that it won’t increase its key interest rate, currently set at minus 0.5%, until inflation moves much closer to its target of 2%, and that it was willing to let inflation run hot to make sure it reaches its goal.
That suggests the ECB won’t start to increase interest rates until 2024 or 2025, analysts said—a decade after the bank first cut its key interest rate below zero, in June 2014. The ECB had previously given a looser commitment to hold interest rates low. (…)
The ECB also reiterated its pledge to buy eurozone debt under an emergency bond-buying program through at least March 2022. (…)
“The likelihood of a tapering announcement in September has meaningfully declined,” said Marco Valli, an economist with UniCredit Bank in Milan. “The fast spread of the Delta variant is certainly playing a role here.” (…)
El-Erian as Sure Inflation Will Stick as Three Other Right Calls “Inflation is not going to be transitory,” the chief economic adviser at Allianz SE said in an interview on Bloomberg TV’s The Open show.
(…) “I have a whole list of companies that have announced price increases, that have told us they expect further price increases, and that they expect them to stick,” El-Erian said.(…)
- In an interview on Bloomberg Television, Ed Hyman, chairman at Evercore ISI, predicted that U.S. inflation will likely exceed expectations and present a challenge for the Federal Reserve.
- “If I was Darth Vader and I wanted to destroy the US economy, I would do aggressive spending in the middle of an already hot economy. You usually get a bubble out of that, and you get inflation of of that. Frankly, we now have both. This is the biggest bubble I’ve seen in my career. (…) What are we going to get out of this? You’re going to get a sugar high, the higher inflation, then an economic bust. (Stan Druckenmiller)
- Utilizing data from Zillow and Apartment List, Ben Breitholtz, data scientist at Arbor Research, predicts that OER will accelerate to between 4.8% and 6.3% year-over-year by December, equivalent to as many as 1.5 percentage points CPI from that 23.7%-weighted component alone. Fannie Mae’s Brescia comes to a similar conclusion. Under the economist’s baseline scenario, the shelter component will add 1.9 percentage points to the index by the second quarter of 2022, nearly accounting for the Federal Reserve’s entire 2% annual inflation target before the other two-thirds of the CPI come into play. (ADG)
World’s Food Supplies Get Slammed by Drought, Floods and Frost
Extreme weather is slamming crops across the globe, bringing with it the threat of further food inflation at a time costs are already hovering near the highest in a decade and hunger is on the rise.
Brazil’s worst frost in two decades brought a deadly blow to young coffee trees in the world’s biggest grower. Flooding in China’s key pork region inundated farms and raised the threat of animal disease. Scorching heat and drought crushed crops on both sides of the U.S.-Canada border. And in Europe, torrential rains sparked the risk of fungal diseases for grains and stalled tractors in soaked fields. (…)
The Food Price Index from the UN’s Food and Agriculture Organization rose for 12 consecutive months through May before easing in June to 124.6 points, still up 34% from a year earlier. (…)
What’s unique right now is that extreme weather seems to be pounding almost every region of the globe. (…)

TECHNICALS WATCH
A wild week within a wild month. My favorite technical analysis firm, which turned cautious earlier this month after being positive for years, remains prudent, unconvinced that recent buyers are strongly committed. Breadth and volume are lacking in this highly selective market. Dip buyers are focused on a few large caps in a few sectors as only 3 S&P 500 sectors made new highs last week. The S&P 500 equal-weight index also failed to make a new high after snapping back from its 100dma.

Meanwhile, the S&P 600 and the Russell 2000 are struggling, trapped under their weakening 100dma.


Large caps remain positive per CMG Wealth’s 13/34–Week EMA Trend Chart…

…but volume displays a waning enthusiasm:

“We got a confluence of all these effects, so the market doesn’t really know: are we opening up again or are we not? Is it inflationary now? Is it deflationary?” said Randeep Somel, a fund manager at M&G Investments in London. (…)
“The momentum is with the variant rather than the vaccines,” said Paul O’Connor, head of multi-asset at Janus Henderson in London. “It’s quite reasonable to expect maybe a lengthy consolidation phase until we get the all clear on the Covid front, and to me that might take a couple of months.” (Bloomberg)
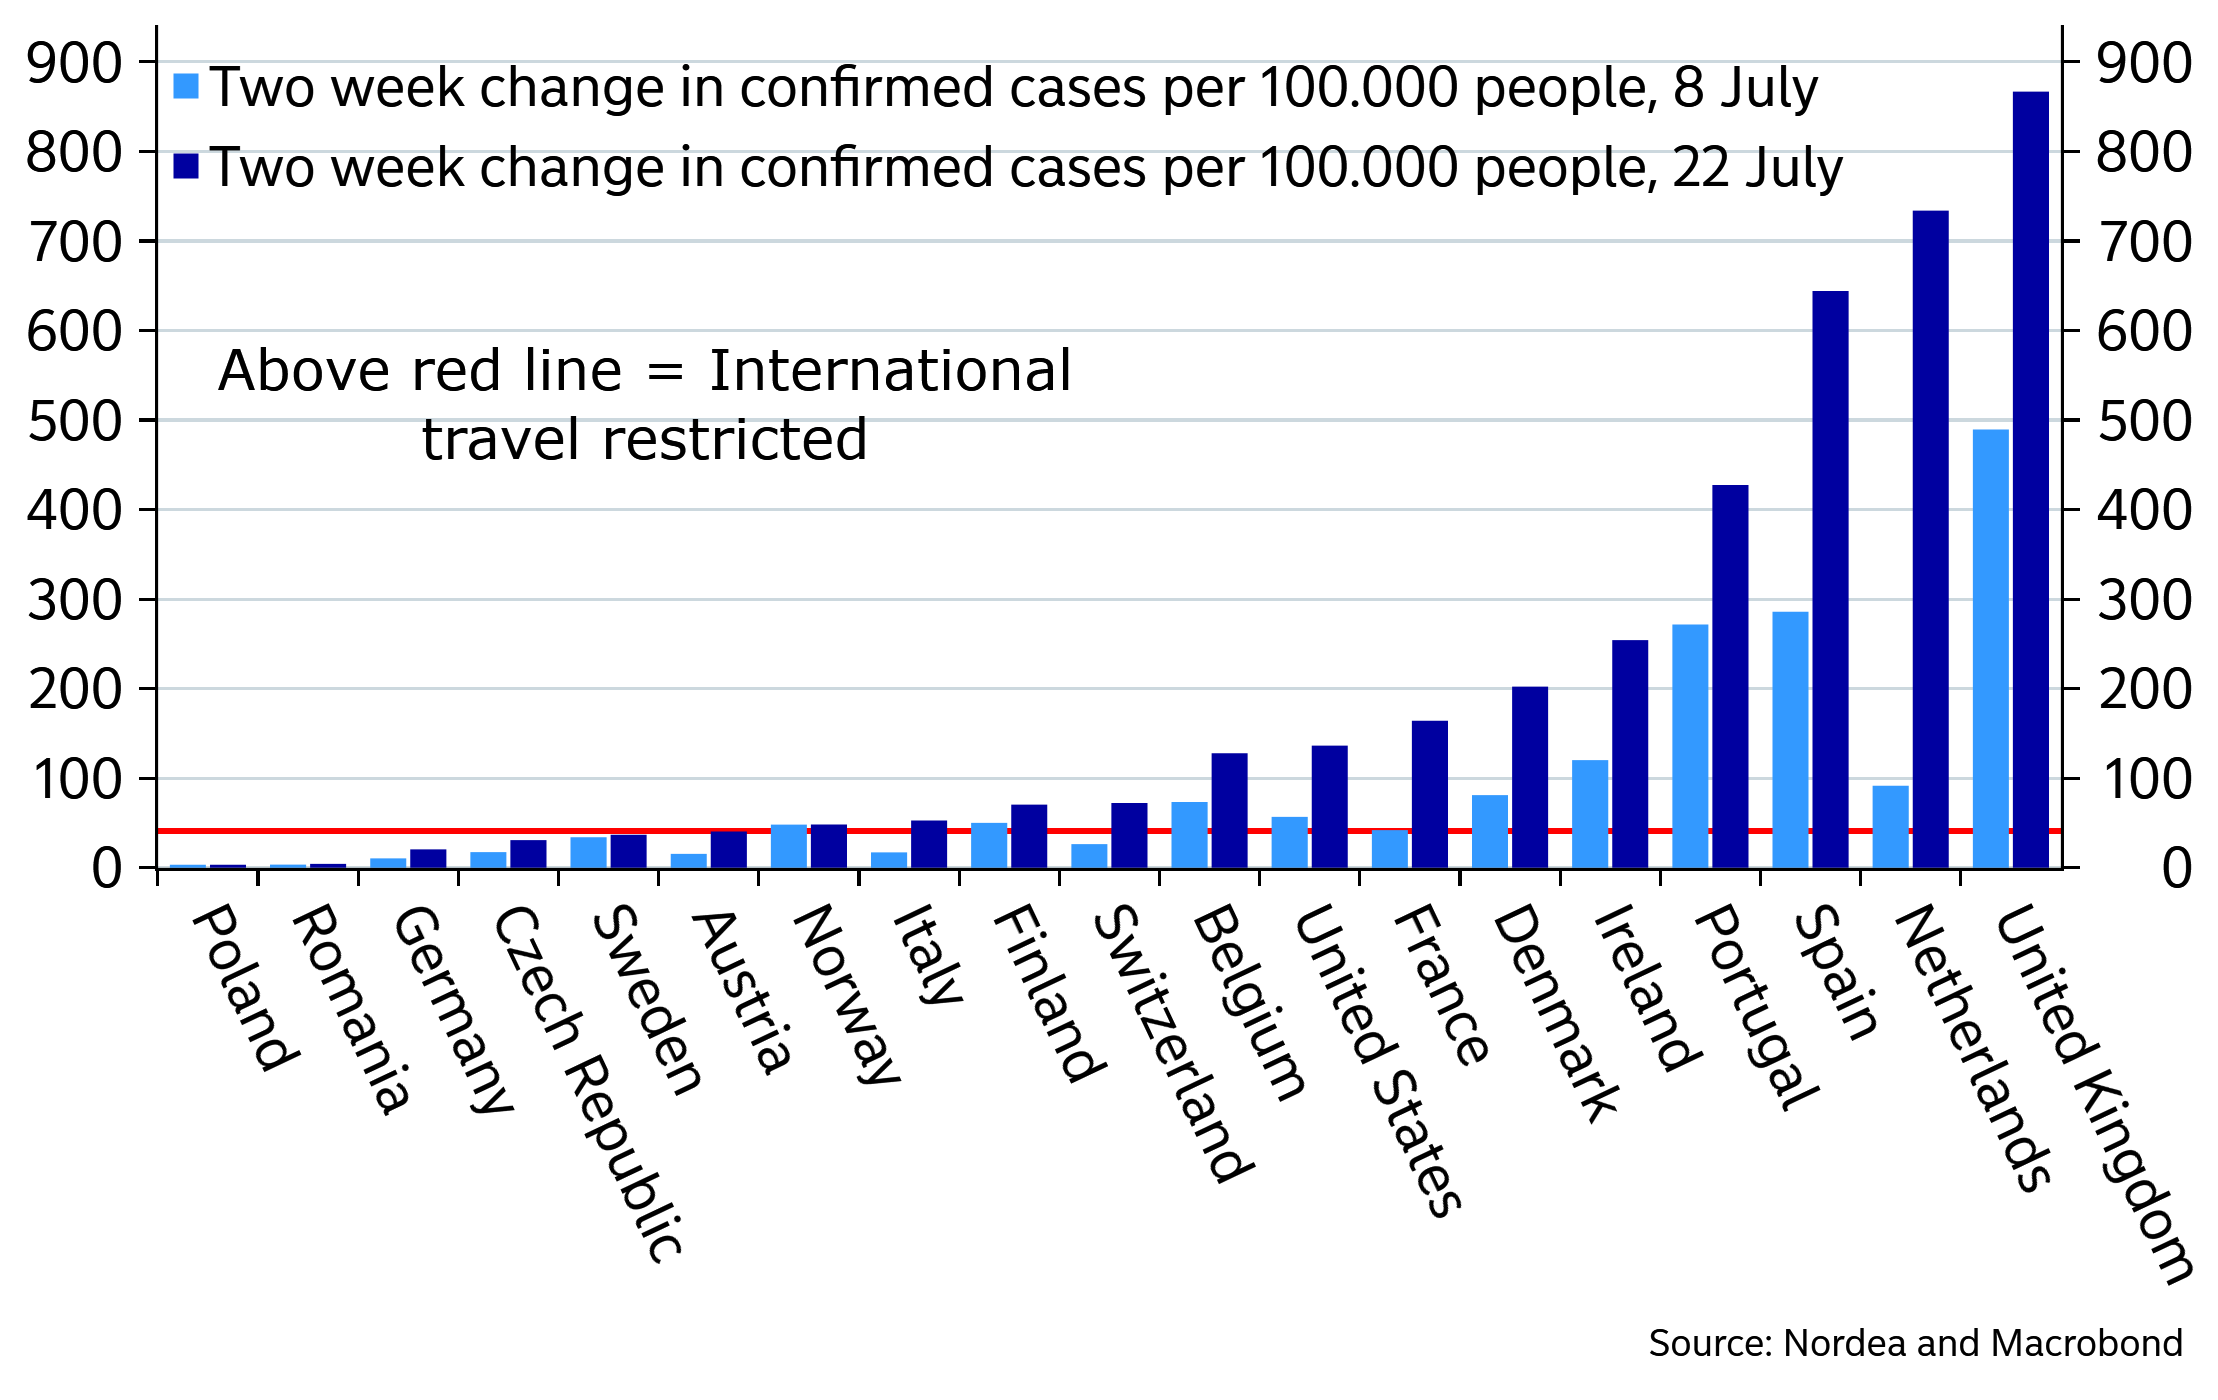
Change in case count per 100.000 people over the past 2 weeks
And yet, much like in 2000, nobody dares going short…

EARNINGS WATCH
From Refinitiv:
Through Jul. 23, 120 companies in the S&P 500 Index have reported earnings for Q2 2021. Of these companies, 88.3% reported earnings above analyst expectations and 10.0% reported earnings below analyst expectations. In a typical quarter (since 1994), 66% of companies beat estimates and 20% miss estimates. Over the past four quarters, 83% of companies beat the estimates and 14% missed estimates.
In aggregate, companies are reporting earnings that are 17.3% above estimates, which compares to a long-term (since 1994) average surprise factor of 3.9% and the average surprise factor over the prior four quarters of 20.1%.
Of these companies, 84.2% reported revenue above analyst expectations and 15.8% reported revenue below analyst expectations. In a typical quarter (since 2002), 61% of companies beat estimates and 39% miss estimates. Over the past four quarters, 74% of companies beat the estimates and 26% missed estimates.
In aggregate, companies are reporting revenue that are 4.1% above estimates, which compares to a long-term (since 2002) average surprise factor of 1.1% and the average surprise factor over the prior four quarters of 3.5%.
The estimated earnings growth rate for the S&P 500 for 21Q2 is 78.1%. If the energy sector is excluded, the growth rate declines to 64.3%. The estimated revenue growth rate for the S&P 500 for 21Q2 is 19.8%. If the energy sector is excluded, the growth rate declines to 16.5%.
The estimated earnings growth rate for the S&P 500 for 21Q3 is 27.2%. If the energy sector is excluded, the growth rate declines to 21.2%.


Trailing EPS are now $177.82. Full year 2021e: $194.34. 2022e: $214.74
Hearing and reading that costs of all sorts are skyrocketing, why is that?

(Data: NABE: Chart: Axios Visuals)
Because of that:

Revenues are booming, thanks to strong demand…and the base effect. According to Factset, 72% of S&P 500 companies will improve their margins this year, the best since 2010, also recovering from a recession. The surprise is that analysts expect that 80% of companies will again improve their margins in 2022. That would be very, very surprising.


")


